Debugging CheckMK checks has already cost me a lot of grey hair. In the meantime, I have learned techniques for different situations, I would like to share with you. So that at least your hair keeps its colour longer...
More...
Because I got the idea for this article while programming the RobotMK-Check, it appears in most code examples. Of course, the techniques presented here are applicable to all checks! So, let's get straight into it.
TL;DR
By the end of this post, you know
- why it is not a good idea to run CheckMK-Checks like a normal Python script
- why it is an even worse idea to try to make a script out of it by force (keyword: main() )
- how to debug a check and intercept stack traces with CheckMK on board tools
- how to debug CheckMK-Checks interactively on the command line with the pdb or ipdb debuggers
- how you can take CheckMK debugging to a whole new level with Visual Studio Code
Two ways how not to debug CheckMK-Checks
na(t)ive execution of the check
Everyone who explores CheckMK on the CLI probably gets this bloody nose:
OMD[cmk]:~/share/check_mk/checks$ python multipath
Traceback (most recent call last):
File "multipath", line 375, in <module>
'group': "multipath",
NameError: name 'check_info' is not defined
The native execution of the check as Python script crashes directly against the wall.
But... why does this happen?
A little explanation.
(Wenn Du schon CheckMK-fit bist, lies weiter bei "Frickelei mit main()".
If you know Nagios and have a look at the check directory of CheckMK (~/share/check_mk/checks, or the same below ~/local for self-written checks) you might get the idea that this is where the "plugins" are located - those scripts Nagios periodically executes to check something and get the result from it.
Nagios plugins are always responsible for data collection and evaluation; they decide whether what was checked is OK, WARNING or CRITICAL. Let's look at a Nagios plugin as a small black box: depending on what we enter (target host, thresholds and other parameters), it will deliver a corresponding result. Input - Output.
The scripts we find in CheckMK below the checks-directories are called "checks" because they are only responsible for the evaluation of the monitoring data. The data was already collected in the agents installed on the hosts.
What such an agent dumps into CheckMK after it has been run is a real mess when viewed alone, specifically a very long text snippet with one section per check type and data in between. Want a sample?
telnet foohost 6556......
<<<tcp_conn_stats>>>
01 13
0A 27
06 3
<<<diskstat>>>
1590958578
8 0 sda 2356123 248021 142890654 598776 1728548 1419646 87541101 5413436 0 755282 6011728
8 1 sda1 226 167 5519 44 1 0 1 0 0 32 44
8 2 sda2 443 0 47564 189 28 0 4257 43 0 200 232
8 3 sda3 2355384 247854 142833291 598529 1652880 1419646 87536843 5334686 0 709185 5932716
253 0 dm-0 886774 0 35962342 183162 997154 0 22444569 6531899 0 366289 6715582
253 1 dm-1 853331 0 6830352 138971 1246280 0 9970240 13460441 0 67739 13611117
253 2 dm-2 865651 0 100037381 338000 829774 0 55122034 3627502 0 343929 3965586
[dmsetup_info]
<<<kernel>>>
1590958578
nr_free_pages 61219
nr_alloc_batch 3864
And who is to understand that now?
Very simple: the "checks" on the CheckMK server do that for us. Each check understands exactly the gibberish in "its" section. Thus, for an agent output with e.g. 18 sections, 18 different checks are also responsible.
To start/parameterize the checks individually would be performance hell, of course. Instead, CheckMK reads all available checks into its memory at startup. To be more precise: it extends its own Python code with the code of the checks by embedding them as modules. The number of checks varies depending on the version of CheckMK - for a 1.6.9 it is over 1,700 checks:
OMD[cmk]:~/share/check_mk/checks$ cmk -L | wc -l
1774
Using the section name in the agent output, CheckMK can jump to the correct check module and transfer the data in the section for evaluation.
But the agent section data is not the only thing the check gets. Also, at runtime, the check must know whether WATO rules exist for this host or service. These may influence the threshold values.
So that much in advance for your understanding why you can't run CheckMK checks directly on bash or with the Python interpreter: the context is missing in the form of agent data and possibly WATO rules (in reality it is a bit more complex, but that should be enough for here).
Fiddling with __main__()
Now you could come up with the idea to simply fake everything that CheckMK passes to the check at runtime and then manually (!) run the functions for inventory and check. Another practical feature of this method is that you can handle the test data relatively openly. The following code block will still cause you physical pain if you complete and use it. Forget it and read on very quickly.
if __name__ == "__main__":
 global check_info
 check_info = {}

check_info['robotmk'] = {
 "parse_function": parse_robot,
 "inventory_function": inventory_robot,
 "check_function": check_robot,
 "service_description": "Robot",
 "group": "robotmk",
 "has_perfdata": True
}

if __name__ == "__main__":
 # own variables...
 # Setting global CMK-Variables, reading test data...
 global inventory_robotmk_rules
 inventory_robotmk_rules = ast.literal_eval(
 open('test/fixtures/inventory_robotmk_rules/discovery_slvel_%d.py' % debugset['discovery_level']).read())
 # Faking agent data
 testdaten = 'test/fixtures/robot/%s/output.json' % debugset['suite']
 mk_output = ast.literal_eval(open(datafile, 'r').read())
 # PARSE
 parsed = parse_robot(mk_output)
 # INVENTORY
  inventory = inventory_robot(parsed)
 # CHECK
 state, msg, perfdata = check_robot("1S 3S 2S 3T", checkgroup_parameters, parsed)
 print "ENDE---"
Debug CheckMK-Check as script
Pro
Contra
Tip:
To force a CheckMK check with main() to a script is fiddling. To debug it, the CheckMK context (agent data, rulesets) must be faked.
Bread and butter: debugging with "cmk" and "print
We are now moving one step up the debugging ladder.
Within the OMD instance there is the CheckMK command line tool cmk (complete documentation: here). This command allows, among other things, to trigger checks manually. Thus, in this case we give CheckMK the command, but please check the agent output with our check. There you go, it is now executed in the CheckMK context:
OMD[cmk]:~$ cmk -nv --checks=robotmk robothost1
Check_MK version 1.6.0p9
+ FETCHING DATA
[agent] Execute data source
[piggyback] Execute data source
No piggyback files for 'robothost1'. Skip processing.
No piggyback files for '127.0.0.1'. Skip processing.
Robot 1S 3S 2S 3T OK - ◯ [S] '1S 3S 2S 3T': PASS (7.69s), OK:
OK - [agent] Version: 1.6.0p9, OS: linux, execution time 0.3 sec | execution_time=0.329 user_time=0.020 system_time=0.000 children_user_time=0.000 children_system_time=0.000 cmk_time_agent=0.317
The individual parameters:
-n- Without this switch, the result of this check would also feed through into the monitoring system. -n ensures that the output is only displayed to us. Use this switch when debugging on a production system.--checks- name of the check that we want to debug (check name: seecmk -L)robothost1- Name of a host that must have been created in the monitoring system
To test it, I put a bug in my check:
print "ups ein" fehlerHere the output of cmk does not help me:
OMD[cmk]:~$ cmk -nv --checks=robotmk robothost1
Error in plugin file /omd/sites/cmk/local/share/check_mk/checks/robotmk: invalid syntax (<unknown>, line 27)
Check_MK version 1.6.0p9
Unknown plugin file robotmk
Unknown plugin file robotmk
+ FETCHING DATA
[agent] Execute data source
[piggyback] Execute data source
No piggyback files for 'robothost1'. Skip processing.
No piggyback files for '127.0.0.1'. Skip processing.
OK - [agent] Version: 1.6.0p9, OS: linux, execution time 0.3 sec | execution_time=0.319 user_time=0.010 system_time=0.010 children_user_time=0.000 children_system_time=0.000 cmk_time_agent=0.293
We still need the switch --debug - then we can see which Python exception occurs in our check. And then we see it together with the stacktrace:
OMD[cmk]:~$ cmk --debug -nv --checks=robotmk robothost1
Error in plugin file /omd/sites/cmk/local/share/check_mk/checks/robotmk: invalid syntax (<unknown>, line 27)
Traceback (most recent call last):
File "/omd/sites/cmk/bin/cmk", line 84, in <module>
config.load_all_checks(check_api.get_check_api_context)
File "/omd/sites/cmk/lib/python/cmk_base/config.py", line 1253, in load_all_checks
load_checks(get_check_api_context, filelist)
File "/omd/sites/cmk/lib/python/cmk_base/config.py", line 1311, in load_checks
load_check_includes(f, check_context)
File "/omd/sites/cmk/lib/python/cmk_base/config.py", line 1422, in load_check_includes
for include_file_name in cached_includes_of_plugin(check_file_path):
File "/omd/sites/cmk/lib/python/cmk_base/config.py", line 1451, in cached_includes_of_plugin
includes = includes_of_plugin(check_file_path)
File "/omd/sites/cmk/lib/python/cmk_base/config.py", line 1519, in includes_of_plugin
tree = ast.parse(open(check_file_path).read())
File "/omd/sites/cmk/lib/python2.7/ast.py", line 37, in parse
return compile(source, filename, mode, PyCF_ONLY_AST)
File "<unknown>", line 27
print "ups ein" fehler
^
SyntaxError: invalid syntax
Now we are already able to display e.g. the content of variables with "print" statements:
myvar = "easy"
print "----> Debugging ist %s" % myvarOMD[cmk]:~$ cmk --debug -nv --checks=robotmk robothost1
----> Debugging ist easy
Check_MK version 1.6.0p9
+ FETCHING DATA
[agent] Execute data source
[piggyback] Execute data source
No piggyback files for 'robothost1'. Skip processing.
No piggyback files for '127.0.0.1'. Skip processing.
Robot 1S 3S 2S 3T OK - ◯ [S] '1S 3S 2S 3T': PASS (7.69s), OK:
OK - [agent] Version: 1.6.0p9, OS: linux, execution time 0.3 sec | execution_time=0.316 user_time=0.020 system_time=0.000 children_user_time=0.000 children_system_time=0.000 cmk_time_agent=0.296Debugging with "cmk"
Pro
Contra
Tipp:
I use this way especially for first "smoke tests", i.e. when I want to see quickly if a check works or not. It is a real shortcut in contrast to testing via the web interface - but nothing more. With "print" you do not debug. Enter Debugger.
Python-Debugger
Puristic: CheckMK and the Python debugger "pdb"
Before we get in here: what is it that makes a debugger, anyway? Debugger is called, which among other things allows me to do the following:
- execute the code line by line
- view and modify all code components (variables, functions, classes, etc.)
- let the code run to a breakpoint and then stop
For this purpose, Python comes with the module pdb :
python -m pdb mein_script.pyAnd we are already in the middle of the current code and can look at everything in peace.
Stop... running the check in the debugger is not the solution. Because even with debugger we will fail because of the missing context of CheckMK (see above).
Thankfully, the cmk command is also a Python script, which allows us to start the complete run in the debugger. All we need first is the path where cmk is stored:
OMD[cmk]:~$ which cmk
~/bin/cmk
OMD[cmk]:~$ python -m pdb bin/cmk --debug -nv --checks=robotmk robothost1
[2] > /opt/omd/sites/cmk/bin/cmk(34)<module>()
-> import os
(Pdb++)
The debugger now stops at the first executable line and waits for us to go through the code with
- "n": execution of next line
- "s": jumping into function
- "r": running to the exit point of the current routine
But we're not in our code part yet and we don't know the exact place in cmk's code where the functions in our check are executed (and we don't want to search for them).
Therefore, we simply set a breakpoint with "b" on the first executable line (27) of our code in the running debugger. (Attention, relative paths are not allowed).
- "r" then lets the debugger run until our breakpoint is reached. Now we are in the middle of our own code and can go through it step by step or even test it with changed data.
- "q" ends the debugger.
- "h" gives a quick overview of the most important commands; the web is full of tutorials around the debugging dinosaur "pdb".
...# Breakpoint setzen: stoppe in Zeile 27 unseres Checks
(Pdb++) b /omd/sites/cmk/local/share/check_mk/checks/robotmk:27
(Pdb++) r
[6] > /omd/sites/cmk/local/share/check_mk/checks/robotmk(27)<module>()
-> myvar = "easy" # manuelles Editieren einer Variable
(Pdb++) n
[6] > /omd/sites/cmk/local/share/check_mk/checks/robotmk(28)<module>()
-> print "----> Debugging ist %s" % myvar
(Pdb++) myvar = "not so hard!"
(Pdb++) n
----> Debugging ist not so hard!
As an alternative to setting the breakpoint at runtime, it can also be anchored in the code; the debugger then automatically stops at this point. You can comment on/off and move the breakpoints - this is much easier than setting the breakpoints every time you start the Debugger.
Attention: you mess around in the code, and in the import header as well. I've gotten into the habit of flagging such temporary changes with an additional comment line so that I can remove all " piles" at the end of my debugging session:
# DEBUGimport pdb
...
...
pdb.set_trace() # <--- Breakpoint
Comfortable: CheckMK and the interactive Python debugger "ipdb
Something like comfort comes up when you use the ipdb instead of pdb. It is part of the interactive (and highly recommended) IPython-Shell and can be easily added by pip install ipdb.
ipdb can be run in the same way (-m ipdb) and excels with
- Tab-Completion of variables, classes and functions
- Embedded IPython-Shell: allows to dive into a "sandbox" for testing during debugging without affecting the scope of the main script
- Syntax Highlighting
- more user-friendly
Debugging with pdb/ipdb
Pro
Contra
Tipp:
Ipython and ipdb are my No. 1 tools when I am directly on the command line (e.g. at the customer's site). Once you have the shortcuts to the flow control, debugging is really easy. And with pdb/ipdb you can hold just about any Python code against the light.
Fast lane: CheckMK remote debugging with VS Code Studio
Yes... of course you don't necessarily have to have a graphical interface for Python development. tmux, vim & Co. offer a lot of possibilities to let off steam. However, my favourite editor remains VS Studio Code - especially since it has mastered working on remote machines for some time now.
In other words: my Mac is running VSC, which has connected to a remote host via SSH (in my case the ELABIT development server with all possible CMK versions, dockers etc.) and not only lets me edit the files there but also debug them. I'll show you how to set that up.
SSH-Connection
As mentioned above, Visual Studio code uses SSH to connect to the server. This is my SSH config in .ssh/config on my Mac:
Host cmk_eldev
Hostname eldev
User cmk
IdentityFile ~/.ssh/id_rsa_eldev
Explanation:
Host- Name of the connection (freely selectable)Hostname- resolvable name or IP address of my development server "eldev“User- Username for the connection (CheckMK Site User)IdentityFile- Path to the SSH PrivateKey; the public key must be stored on the OMD site in$OMD_ROOT/.ssh/authorized_keys
With this SSH-Config it is now possible for me - and also VSC - to jump directly to eldev:
datil 01:11 $ ssh cmk_eldev
Last login: Sun May 31 20:59:59 2020 from datil.fritz.box
OMD[cmk]:~$
Provide code
In this example I want to debug the CheckMK check of RobotMK. For me it has proven to be best to clone the repository at a separate location ($OMD_ROOT/robotmk) and symlink the check into CheckMK:
[cmk]:~/local/share/check_mk/checks$ ln -sf ~/robotmk/checks/robotmk robotmk
OMD[cmk]:~$ cd local/share/check_mk/checks/
OMD[cmk]:~/local/share/check_mk/checks$ ln -sf ~/robotmk/checks/robotmk robotmk
The advantage is that I don't have to copy the file back into the repository to commit!
VSC-Plugin "Remote Development"
I now open Visual Studio Code and install via the plugin management the plugin "Remote Development":

After installation, the toolbar on the left shows the icon of the "Remote Explorer":
When I click on it, I see all the connections defined in my SSH config - including the most recently created one, which can now be activated by right-clicking:

Bei der erstmaligen Verbindung kann es ca. 30 Sekunden dauern, bis VSC im Homedir des Remote-Users (cmk) das entsprechende Gegenstück (.vscode-server, NodeJS-basiert) installiert hat.
Dass der Remote-Server läuft und Dein VSC mit ihm verbunden ist, sieht man jetzt links unten in der Statusleiste:
From this point on, it is also possible that certain other plug-ins, which are normally visible on the left side of the toolbar, have disappeared. This is normal. This is because the "server" part of VSC now runs on the host eldev. The "client" part of VSC on my Mac only serves as a display frontend.
Remote-VSC-Plugin "Python"
So VSC on eldev is almost virgin - in order to debug Python, I have to at least install the Python extension again. It also comes with the debugger, which we will get to know in a moment.

Open working directory
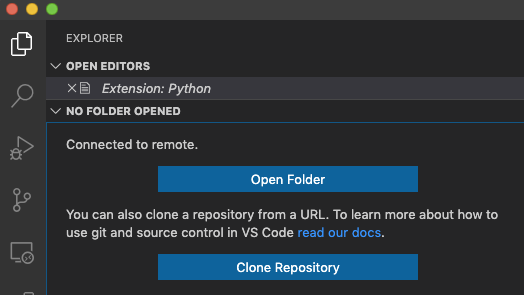
Next, I integrate the complete home-dir of the OMD site: to do this, I click on "Open Folder" and select as suggested /omd/sites/cmk:

Create debugging configuration "launch.json"
Now that I have installed the Python extension, I can open the debugger:
This, however, still needs to be configured; I use the suggested link "create a launch.json file" and then select "Python File" as configuration type:
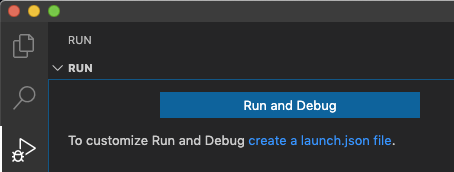
With the JSON file "launch.json" I tell Visual Studio Code exactly which file I want to debug with which interpreter and which arguments. I can create any number of such debug configurations. The easiest one, namely to debug the currently opened file, is already available.
For our "special case" ~/bin/cmk with its arguments I create another configuration called cmk - robot:
{
 "version": "0.2.0",
 "configurations": [
 {
 "name": "Python: Current File",
 "type": "python",
 "request": "launch",
 "program": "${file}",
 "console": "integratedTerminal"
 },
 // my new Check-Debug-Config
 {
 "name": "cmk - robot",
 "type": "python",
 "request": "launch",
 "program": "${workspaceFolder}/bin/cmk",
 "args": [
 "-v",
 "-n",
 "--checks=robotmk",
 "robothost1"
 ],
 "console": "integratedTerminal",
 "pythonPath": "${workspaceFolder}/bin/python"
 }
 ]
}
Explanation:
type- should be clearrequest- besides "launch" there is also "test" to do unit testsprogram- the program to be started. Note the variable for the workspace folderargs-each argument (see above) is a separate list elementconsole- where do you want the output to end uppythonPath- very important: which Python should be used? Of course, the one from OMD!
Start the debugger
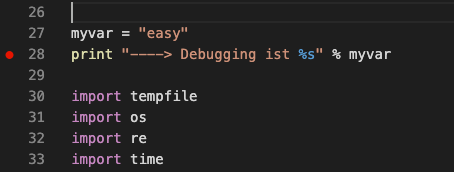
Now it is time to run the debugger. But first I set a breakpoint in "robotmk" by clicking the line and pressing "F9" (Set Breakpoint). The red dot shows me this:
The debugger starts by selecting the just created debugging-config cmk - robot and clicking the green arrow next to it (or pressing "F5"):
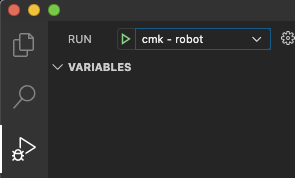
And as expected, the debugger stops at the breakpoint in the middle of my check, with the complete CheckMK context around it!
You get the hang of it pretty quickly, where breakpoints make sense. When a breakpoint is reached, I can press "F11" to descend e.g. functions that belong to CheckMK and see exactly what they do there. I find this especially important, because the (otherwise excellent) documentation of CheckMK is a big white spot regarding development. Many of the functions and modules are already documented in the code.
The variable inspector on the left always shows the current local and global variable scope. By mouse-over I can see the value of variables at any place in the code.

The Debug Console in the lower area also gives me the opportunity to test my own Python snippets in the current context. Therefore, it is not necessary to jump back and forth between SSH terminal and VSC:
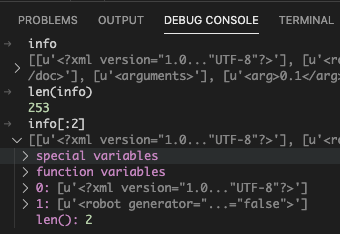
Remote-Debugging with VS Code
Pro
Contra
Tipp:
Own checks and plugins can be developed and debugged extremely comfortably via remote debugging in Visual Studio code. VSC impresses me especially with its open plugin interface (e.g. to write and debug robot tests with it) and its streamlined surface.
Thanks to Pytest-support, tests can be started and debugged selectively.
Who doesn't get warm with VSC: PyCharm also has the Remote-Debugging-Feature; but I personally don't think it is as well implemented as in VSC.
And last but not least I don't want to underestimate the wow-effects of a well done debugging cockpit. Especially seeing foreign code in context with live data during execution is extremely valuable.
Summary
Of course, this method does not restrict you to CheckMK checks. For example, to debug a plugin, all you need is an SSH connection that allows you to edit the plugin in /usr/lib/check_mk_agent/plugins/.
Which of the debugging techniques presented here will work for you depends on what code you are debugging and the environment you are in.
Smaller fixes can easily be done with ipdb (or pdb if you don't want to install anything). For developing your own checks and plugins, the Python debugger in VSC is an unbeatable tool. You need a desktop interface (Win/Linux/Mac) in which Visual Studio code is started.
Bonus
If you develop CheckMK checks with PyTest: The Python plugin in VSC offers the special treat of debugging PyTest tests in the same way as the one presented here. With RobotMK, this helps me to see during development where I might be shooting myself in the knee when tests go red

Wow, what a great post Simon!